Bar-by-bar replay
Play, pause, step one candle at a time or run it at speed, on twelve timeframes from one minute to one month. Go to any date in the history and start from there.
Replay the market bar by bar, trade it the way you would live, and see what your plan really does.
Backtest 1350+ instruments across forex, indices, metals and crypto
Trade years of real price action one bar at a time — with your own rules, your own risk, and none of your capital.
Create a free accountFree to start. No credit card required.
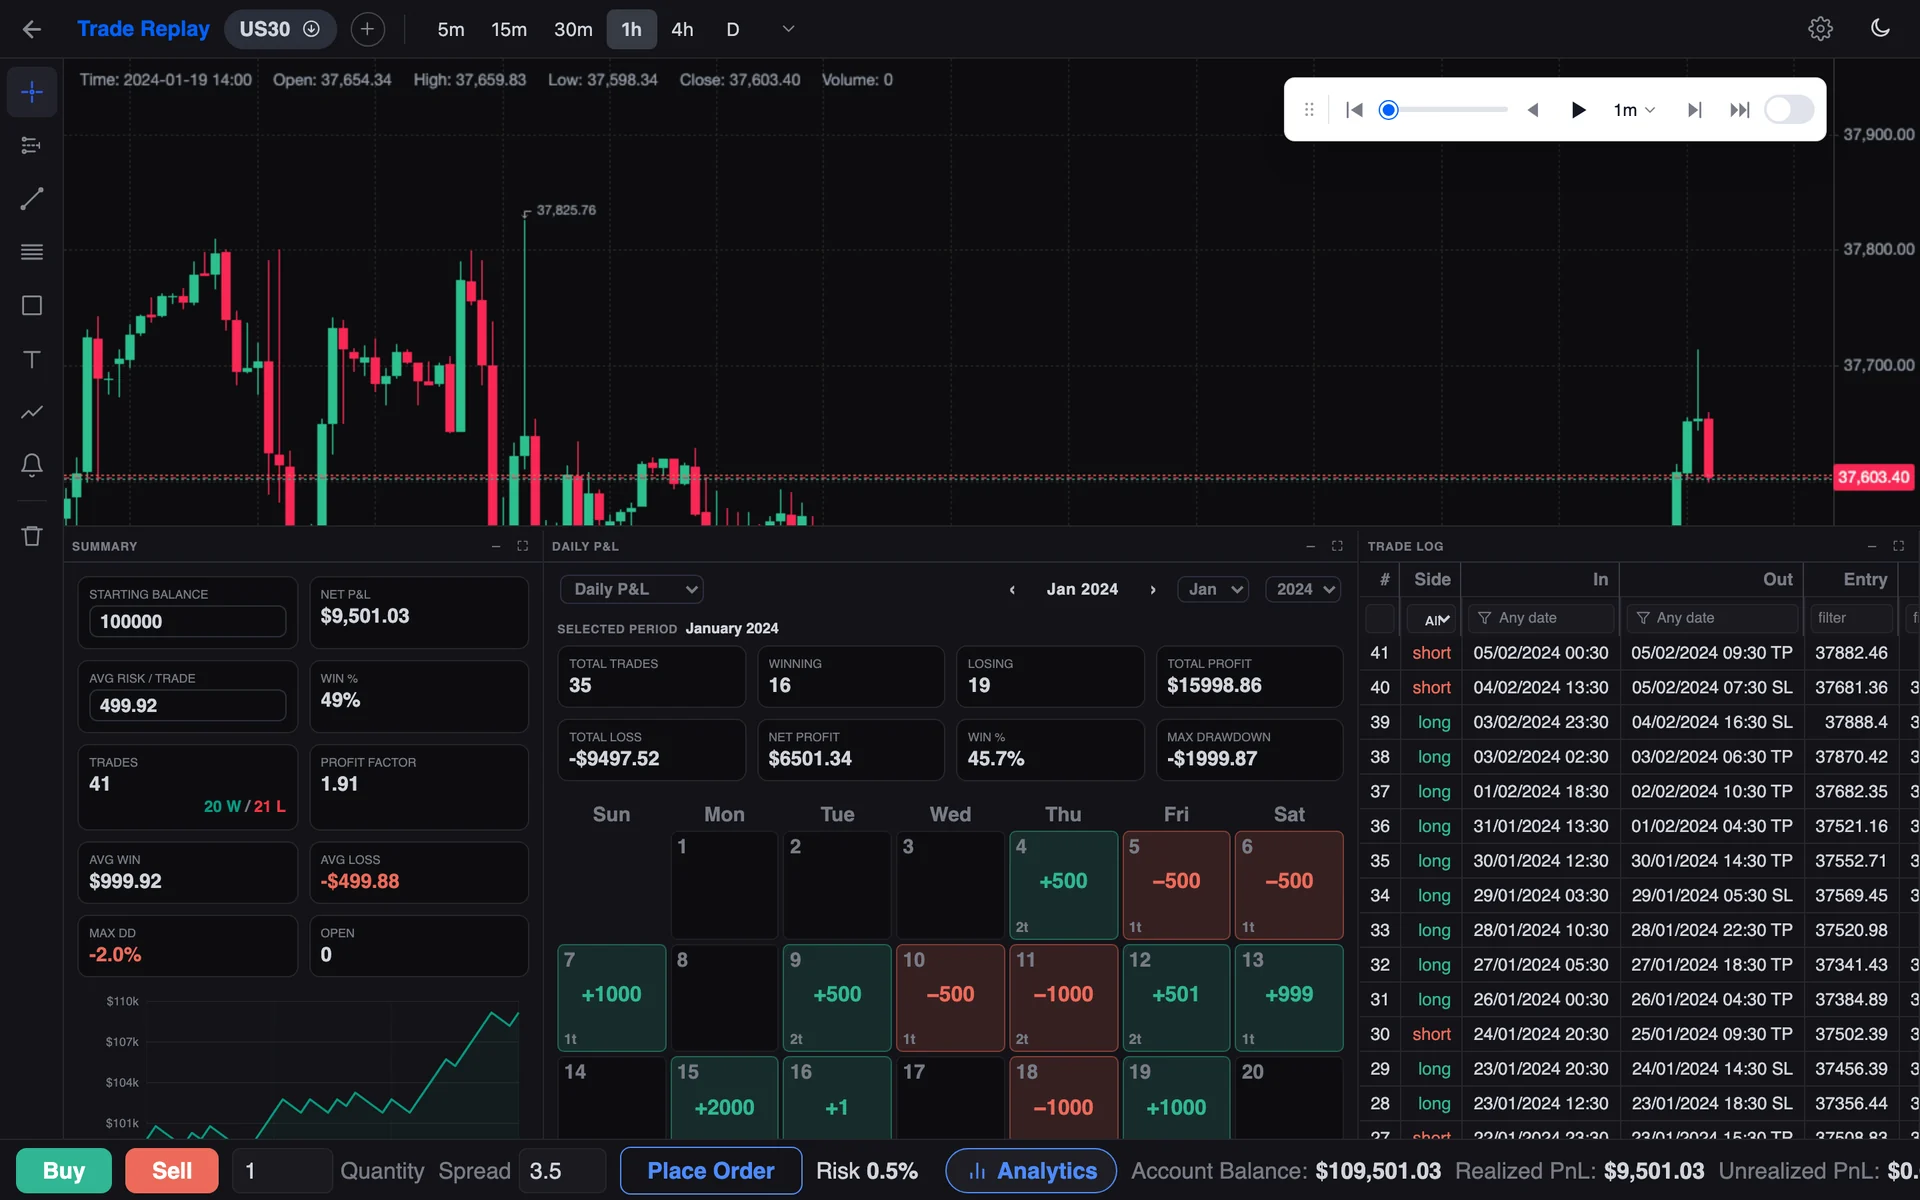
From the first bar you replay to the last line in the trade log.
Play, pause, step one candle at a time or run it at speed, on twelve timeframes from one minute to one month. Go to any date in the history and start from there.
Place a long or short at the cursor with entry, stop and target, and read the R:R and the cash risk off your balance and risk percentage. Arm it and it fills when price arrives — and a bar that straddles both takes the stop, not the target.
Trend lines, rectangles, triangles, circles, text and a full Fibonacci with every level, colour and extension configurable. They stay anchored to their candle through a timeframe change, and they save with the session.
EMA, Bollinger Bands and Liquidity Swings, drawn natively so the chart you test on reads exactly like the chart you trade on. No repainting between the two.
Win rate, profit factor, expectancy, total R, average R, net P&L and maximum drawdown, with an equity curve, a performance calendar and the full trade log — updating with every fill instead of at the end.
Candles, trades, drawings, indicators and alerts are all saved to your account. Close the tab, come back next week, and the session opens exactly where it stopped.
No install, no data files, no spreadsheet. It runs in the browser.
Name a session, choose the market, set the starting balance and the window you want to test. Six instruments are loaded already; any other one downloads on demand.
Step the chart forward and trade it the way you would live — entry, stop, target, position size off your own risk percentage. No hindsight, because the next bar has not been drawn yet.
Open the report. Win rate, expectancy, drawdown, the equity curve and every trade you took, on a sample size you can see. Then change one rule and run it again.
The chart is where the decision happens. The report is where you find out whether it was a good one.
Where the decision gets made
Twelve timeframes from one minute to one month, on the same candles a live chart would show you. Step forward one bar, play at speed, or jump to a date and start there.
Where the answer comes from
Every fill is logged as you go, and the numbers update with it — so the sample size is on screen while you are still trading, not a month later.
Six instruments are loaded and ready the moment you sign in. Every other one in the 1350-instrument catalogue is a search away — pick it, and the minute-by-minute history downloads to your account.
What is Trades Replay?
Trades Replay is a browser-based market replay and backtesting platform. It plays real historical price data back to you one bar at a time so you can practise execution and test a strategy without risking money. You place trades on the replayed chart exactly as you would live, and the platform logs every one of them and reports the result.
Is it free?
Yes — you can create an account and start backtesting for free, and no card is asked for. Paid plans are listed on our pricing page: Intermediate is $14 a month or $140 a year, and Pro is $30 a month or $300 a year, in US dollars. You can cancel at any time, and our refund policy explains when a refund applies.
Which markets and timeframes can I backtest?
Forex pairs, stock indices, metals and crypto — around 150 instruments in all. Six are loaded and ready the moment you sign in: US30, NAS100, S&P 500, EURUSD, USDJPY and XAUUSD. Any other instrument in the catalogue is a search away, and its minute history is downloaded for you.
Twelve timeframes are available on every instrument: 1m, 3m, 5m, 10m, 15m, 30m, 1h, 2h, 4h, 1d, 1w and 1M.
Do I need to install anything?
No. It runs in the browser, on the desktop or the laptop you already use. There is no download, no data file to source and no spreadsheet to maintain — your sessions live in your account and are there on the next machine you log in from.
Does my work get saved?
Every session saves itself: the candles you are on, the trades you have taken, your drawings, your indicators and your alerts. You can close the tab mid-backtest and open the session weeks later exactly where it stopped.
Is this real trading?
No, and that is the point. Trades Replay is not a broker: it executes nothing, connects to no live market and never touches your money. Everything is simulated on historical data, for education and practice.
Can a backtest tell me whether my strategy will work?
It can tell you how your rules behaved on the history you tested, on a sample size you can see — which is a far better basis than a hunch. It cannot promise the future. Simulated results are produced with hindsight and do not account for slippage, liquidity or costs; read the Risk Disclosure before you trade anything live.
Open an account, pick an instrument and a date, and take your first replayed trade in about a minute. Nothing to install, no card, and your sessions are still there tomorrow.
Create your free account